Yottaa's Impact Dashboard
The Yottaa's Impact dashboard shows how Yottaa is improving your site's performance. If your site does not have enough optimized and unoptimized traffic, some metrics do not appear. By default, the dashboard shows data from the last seven days. To change the time period, click the calendar icon  in the top right corner. To refresh the data, click the refresh icon
  .
.
|
Example |
Metric |
Description |
|---|---|---|
|
|
Faster Page Load Time |
The percent difference between your optimized and unoptimized page load time. |
|
|
Sessions Optimized |
The number of sessions |
|
|
More Target Zone Sessions |
Compares the percent of sessions that fell within the target zone in optimized and unoptimized traffic. The target zone is the page load time range at which the majority of conversions take place and at which your site's conversion rate is the highest. This number varies across sites. (Not available for all customers). |
|
|
Fewer Third Party Violations |
The percent difference between the amount of violations |
|
|
Shopper Time Saved |
Yottaa calculates the larger number by multiplying the performance improvement (difference in average page load time between optimized and unoptimized sessions) by the number of page views during the selected period. The per-session number is calculated by multiplying the performance improvement by the average number of pages viewed per session |


This section is not available for all customers. Click the orange arrow ![]() next to the section title to open the Conversion Insights dashboard.
next to the section title to open the Conversion Insights dashboard.
|
Example |
Metric |
Description |
||||||||
|---|---|---|---|---|---|---|---|---|---|---|
|
|
Optimized Sessions in Conversion Zone |
The percent of optimized sessions that fell within the Conversion Zone A session
|
||||||||
|
|
Unoptimized Sessions in Conversion Zone |
The percent of unoptimized sessions that fell within the Conversion Zone during the selected period. |
||||||||
|
|
Yottaa's Impact |
The percent difference between optimized and unoptimized sessions in the Conversion Zone. |
||||||||
|
|
Conversion Zone Comparison |
Compares the following metrics in and out of the target zone:
|


Target Zone Analysis Graph
Use the drop-downs to compare metrics in the graph. The scale for the metric in the right drop-down appears on the right side of the graph.

The following options are available:
Totals:
| Sessions | Displays a bar graph where each bar represents the total sessions that fell within a range of average page load times. |
| Conversions | Displays a bar graph where each bar represents the total conversions that fell within a range of average page load times. |
| Conversion Rate | Displays a line graph showing the conversion rate for each average page load time. |
| Bounce Rate | Displays a line graph showing the bounce rate for each average page load time. |
Optimization Comparison
| Session Breakout | Displays a bar graph showing the percent of sessions that were optimized and unoptimized for each range of average page load times. |
| Conversion Breakout | Displays a bar graph showing the percent of conversions for optimized and unoptimized conversions for each range of average page load times. |
| Conversion Rate Breakout | Displays a line graph showing the optimized and unoptimized conversion rates for each page load time. |
| Bounce Rate Breakout | Displays a line graph showing the optimized and unoptimized bounce rates for each page load time. |
| Yottaa's Impact | Displays a line graph showing the percent difference in page load time for optimized and unoptimized traffic. |
Cumulative
| Cumulative Sessions | Displays a bar graph showing the cumulative sessions for each range of average page load times. For example, the 6-7 second bar includes all sessions for page load times of 0 to 7 seconds. |
| Cumulative Conversions | Displays a bar graph showing the cumulative conversions for each range of average page load times. For example, the 6-7 second bar includes the percent of conversions that occurred for sessions with an average page load time of 0 to 7 seconds. |
| Cumulative Conversion Rate | Shows a line graph of the cumulative conversion rate |
| Cumulative Bounce Rate | Shows a line graph of the cumulative bounce rate |
Use the drop-downs to compare metrics in the graph. The scale for the metric in the right drop-down appears on the right side of the graph.
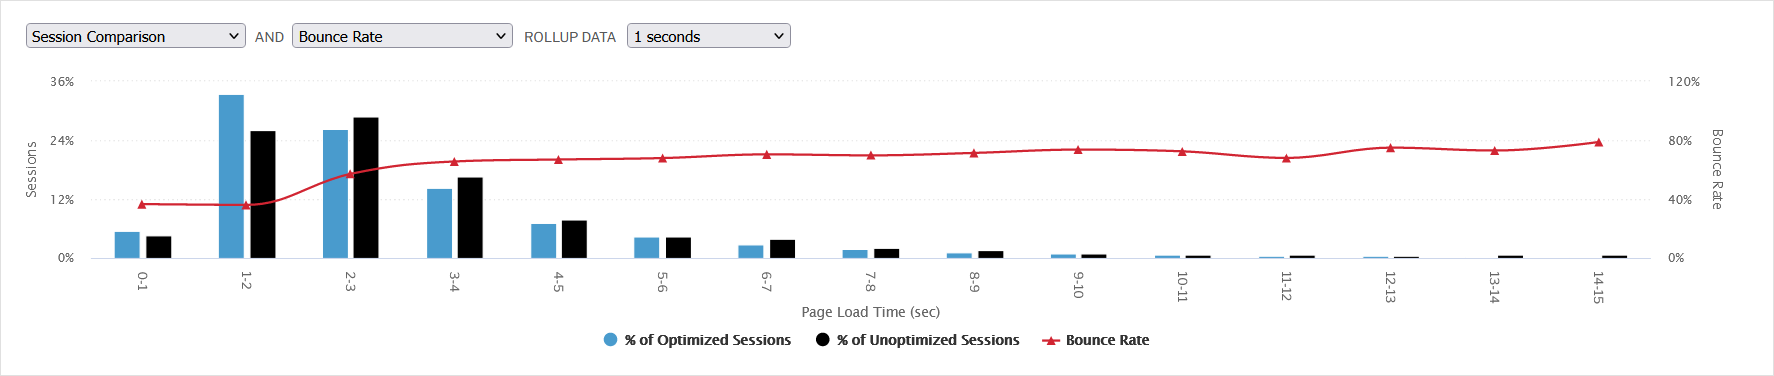
The following metrics are available:
Totals:
| Sessions | Displays a bar graph where each bar represents the total sessions that fell within a range of average page load times. |
Optimization Comparison
| Session Comparison | Displays a bar graph showing the percent of sessions that were optimized and unoptimized for each range of average page load times. |
| Bounce Rate Comparison | Displays a line graph showing the optimized and unoptimized bounce rates |
| Yottaa's Impact | Displays a line graph showing the percent difference in page load time for optimized and unoptimized traffic. |
Cumulative
| Cumulative Sessions | Displays a bar graph showing the cumulative sessions for each range of average page load times. For example, the 6-7 second bar includes all sessions for page load times up to 7 seconds. |
| Cumulative Bounce Rate | Shows a line graph of the cumulative bounce rate |
Impact on Device Types
This section shows how Yottaa is impacting a variety of metrics on each device type. Use the drop-downs at the top of the section to select a performance metric and a statistic. Click the orange arrow ![]() next to the section title to open the Web Vitals dashboard.
next to the section title to open the Web Vitals dashboard.
The following metrics are available:
| Page Load Time |
The amount of time it takes for the initial HTML document to be loaded with all stylesheets, images, and subframes, and all event handlers for window.onload to be called. At this point, the page is interactive to users. Throughout the Yottaa portal, "onload time Also referred to as "onload time." |
| Time to Interactive |
Measures the time when the page becomes reliably interactive to users by searching for a five-second pause in network activity after the last long task following the first contentful paint. TTI is the moment when that long task ends. If there is no long task after first contentful paint, TTI is the moment that first contentful paint is complete. |
| First Contentful Paint | When the browser renders the first bit of content from the DOM, which signals to the user that the page is loading. This content can include text, image (including background images), non-white canvas or SVG. |
| First Input Delay | The time it takes for the page to respond to the first user interaction (for example, a click, tap, or a scroll). |
| Largest Contentful Paint | The time it takes for the largest piece of visible content on a page to load.
|
Click one of the data boxes to change the charts and graphs that appear below:
|
Example |
Metric |
Description |
|---|---|---|
|
|
Overall Page Load Time |
Shows the overall metric for both optimized and unoptimized traffic as well as the amount optimized traffic improved. |
|
|
Desktop Page Load Time |
Shows the desktop metric for both optimized and unoptimized traffic and well as the amount that optimized traffic improved. |
|
|
Mobile Page Load Time |
Shows the mobile metric for both optimized and unoptimized traffic and well as the amount that optimized traffic improved. |


Device Type Comparison Graph
This graph shows how optimized and unoptimized traffic have changed over time during the selected period. You can select the metric and device type using the drop-downs and data boxes at the top of the section

All Devices by Page Category
This table shows how optimized and unoptimized traffic performed in each page category for the selected metric. Click any column header to sort the table.

Impact on Third Parties
Click the orange arrow ![]() next to the section title to open the Performance Inventory.
next to the section title to open the Performance Inventory.
This table shows how Yottaa is affecting the performance of third parties on your site based on how many page delay violations the third party is causing for optimized and unoptimized traffic. Use the drop-down at the top to filter the table based on the percent of pages on which third parties appear. The third parties that appear on a higher percentage of pages have a greater impact on your site.